Free Indicators

LIQUIDITY CATCHER

The Liquidity Catcher indicator highlights price zones where limit orders soak up market orders, providing key signals of liquidity dynamics
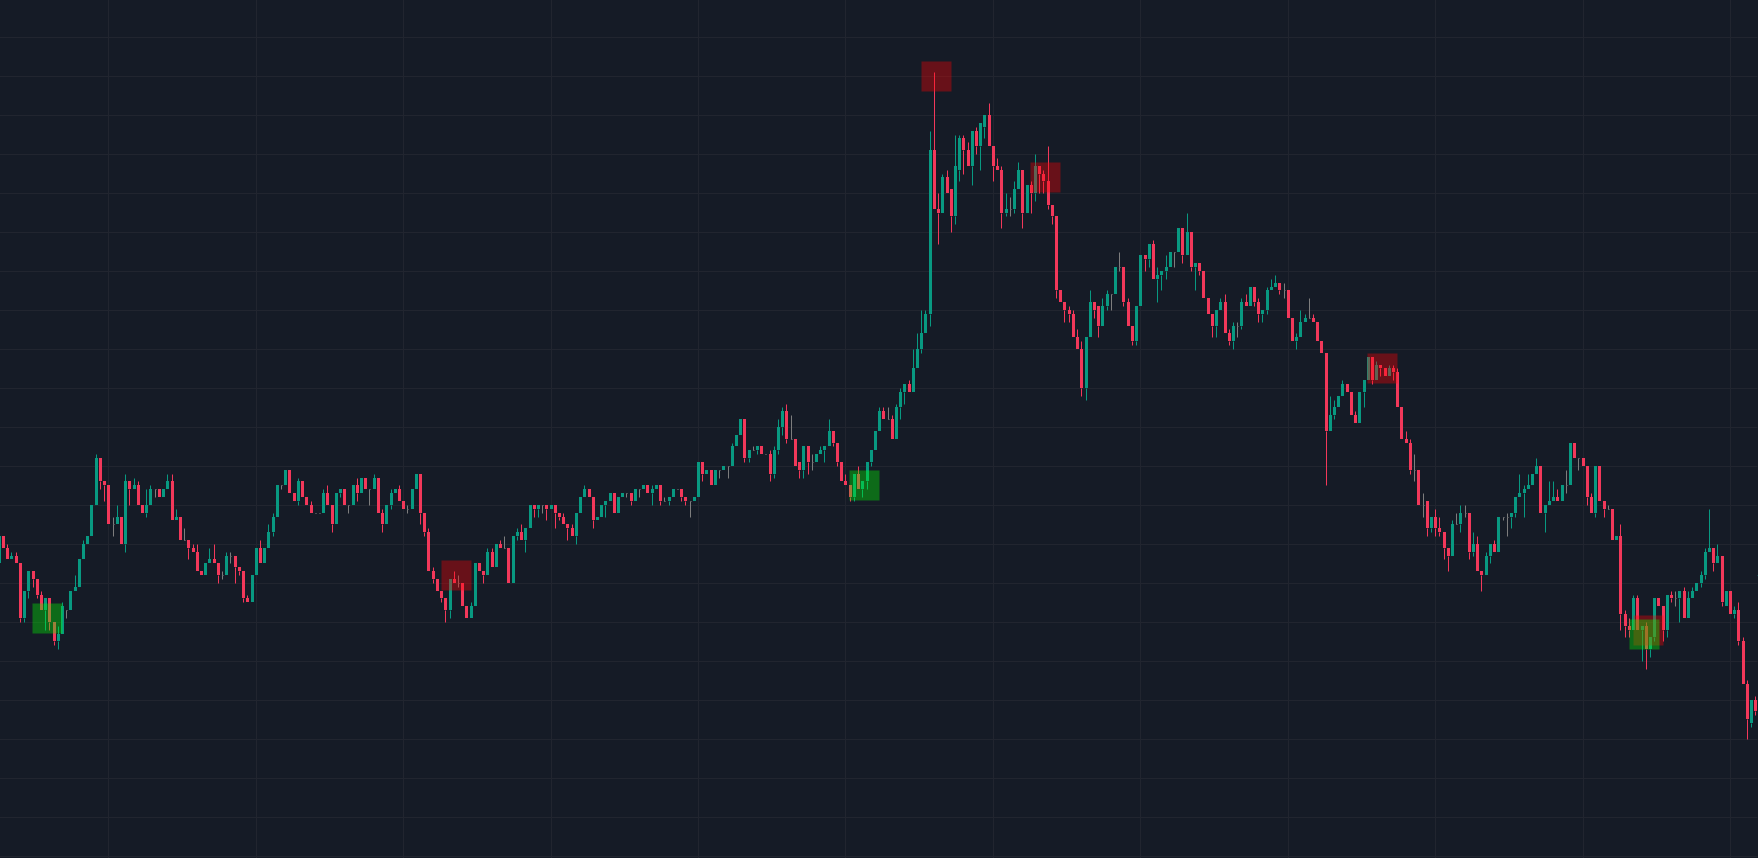
Stock or cryptocurrency trading chart showing rising and falling prices with red and green markers indicating buy and sell signals.

POC PIVOT

The POC Pivot indicator draws out signals where there are prominent points of control, highlighting where volume is highly directional
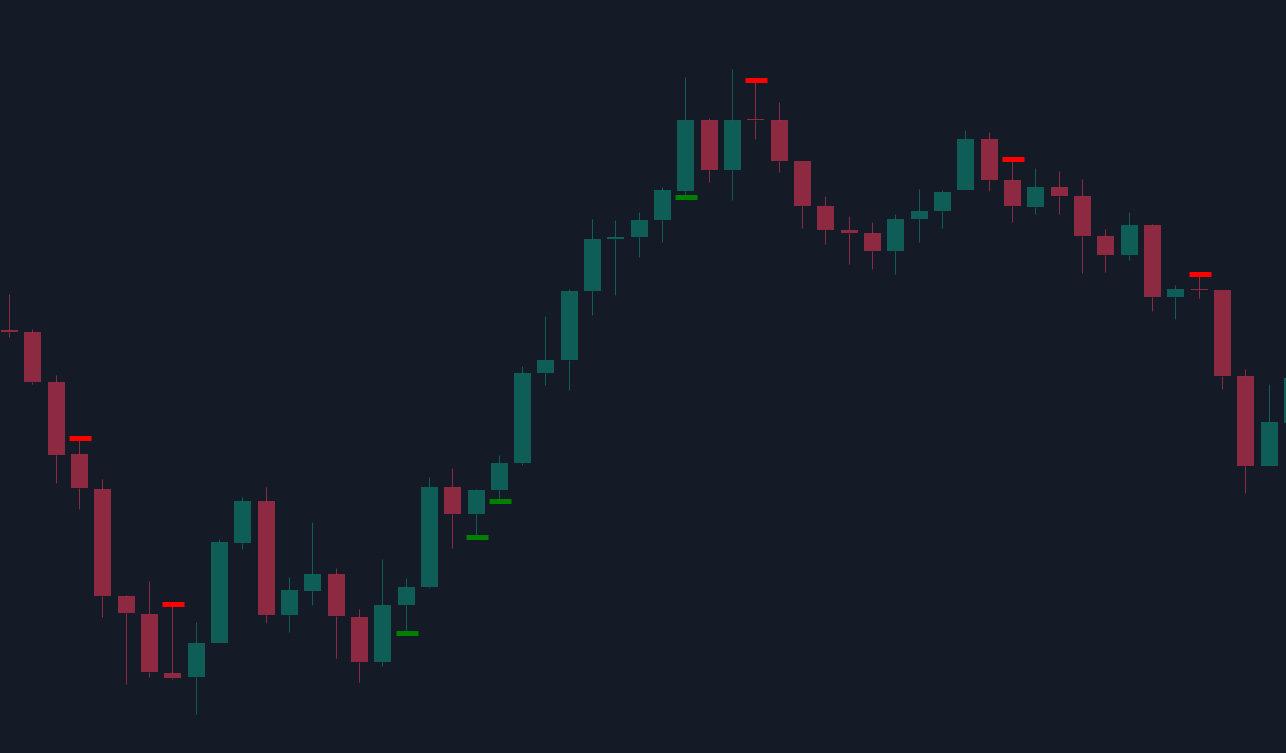
A candlestick chart showing a price trend with fluctuations, including green and red candlesticks, on a dark background.

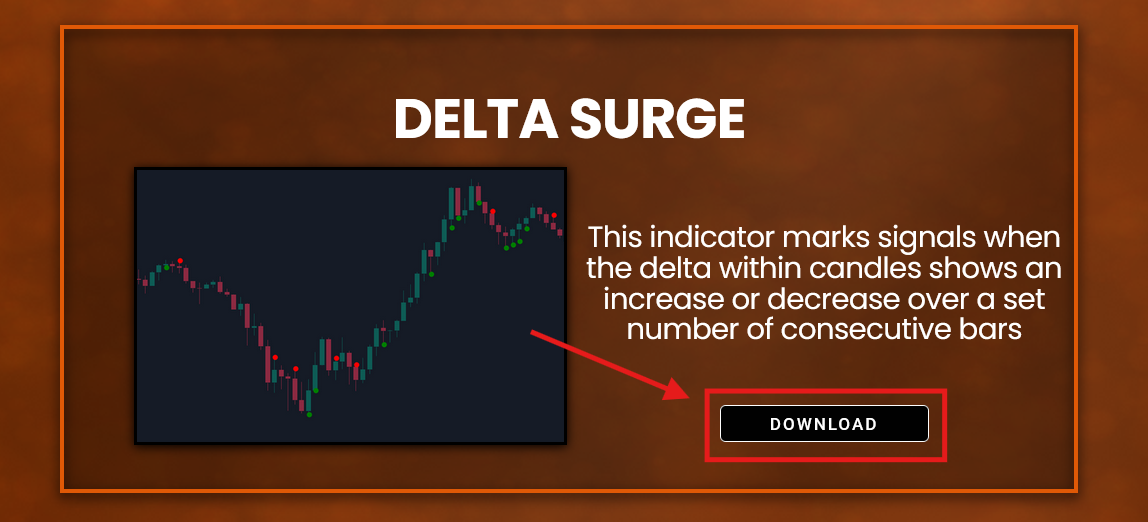
DELTA SURGE

This indicator marks signals when the delta within candles shows an increase or decrease over a set number of consecutive bars
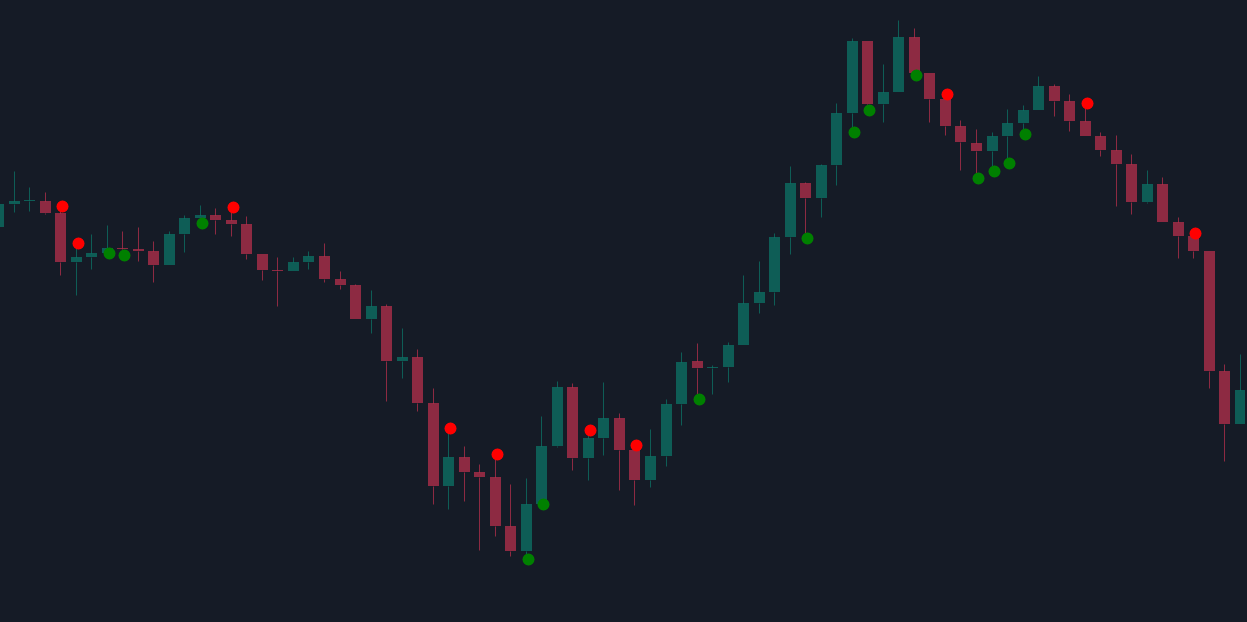
A financial candlestick chart showing market fluctuations with red and green indicators.

TRAPPED TRADERS

The Trapped Traders indicator analyzes big market orders stuck in losing positions, signaling potential reversals or liquidity grabs
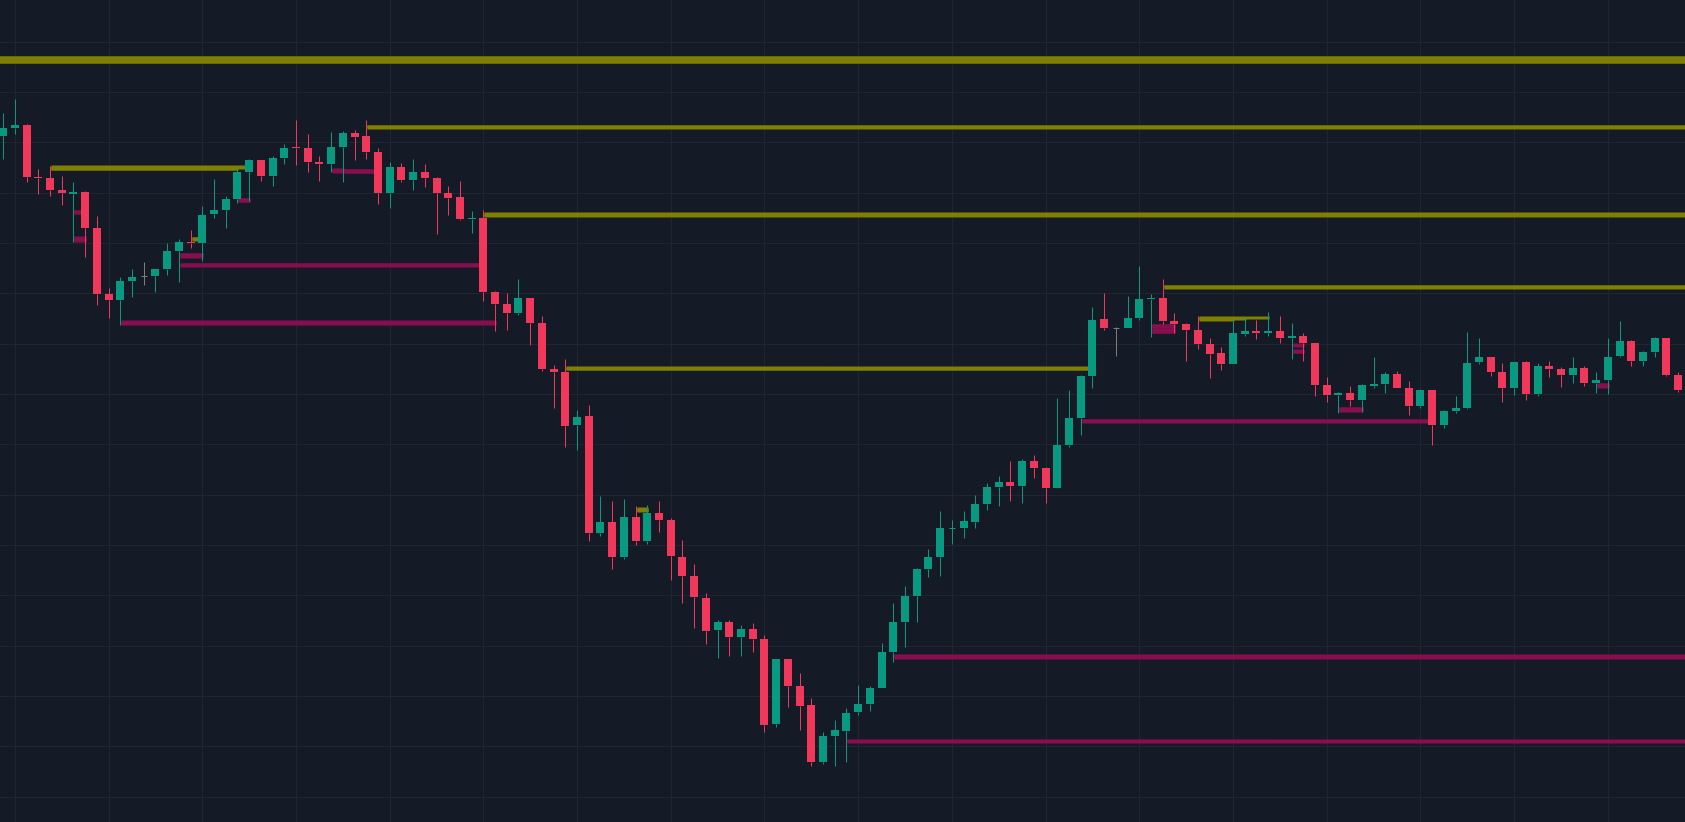
A financial candlestick chart displaying a downward trend with resistance and support levels marked by yellow and pink lines.

WHALE ORDERS

An indicator that detects significant orders, highlighting potential areas of institutional activity
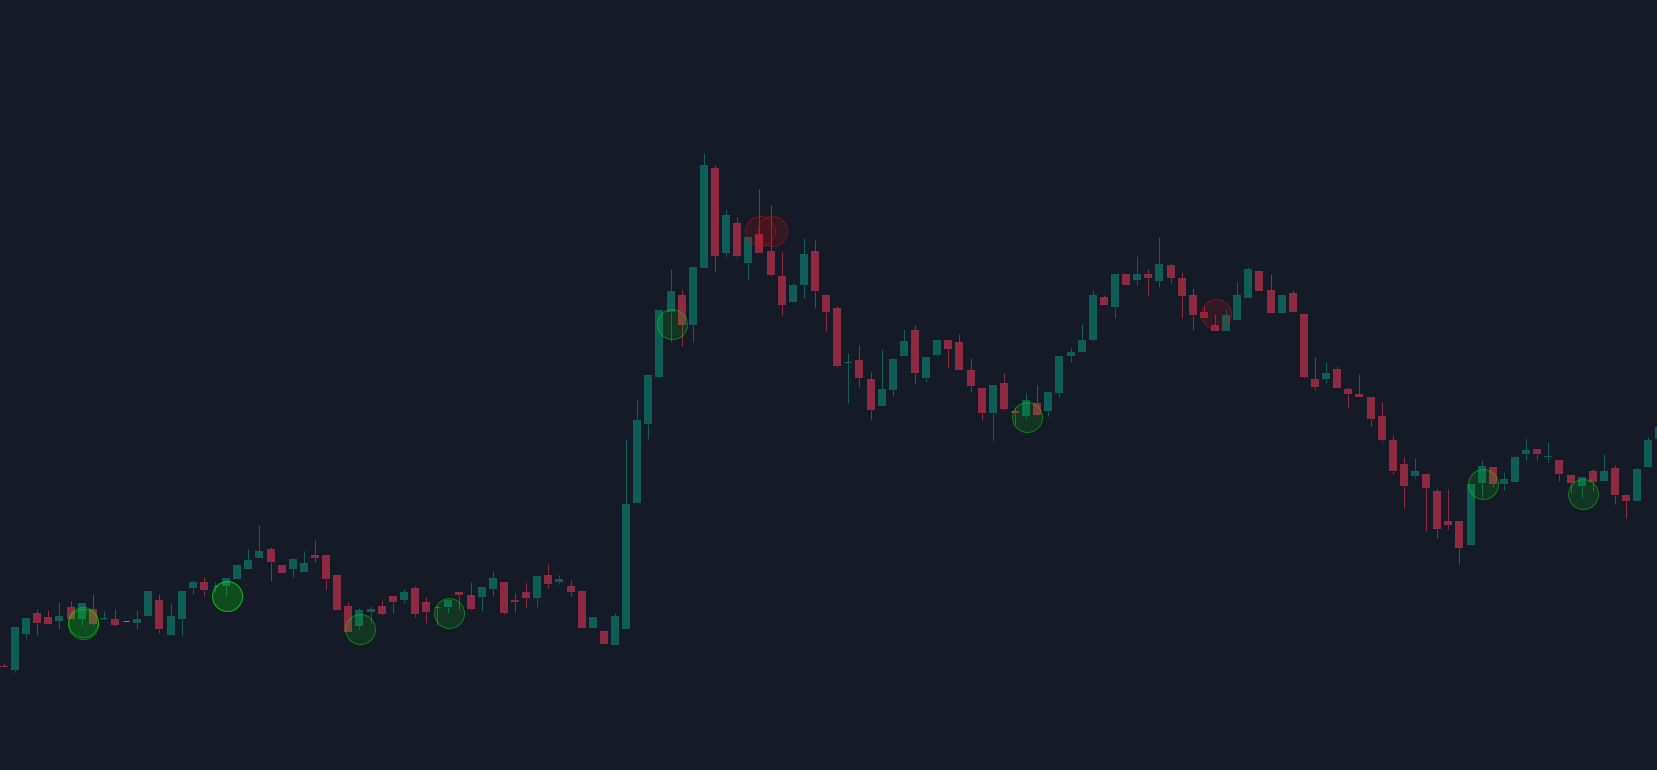
A stock market candlestick chart with green and red circles marking buy and sell signals.

SUPPORT & RESISTANCE

A support and resistance indicator that identifies naked swing levels in real-time, a valuable tool for breakout strategies
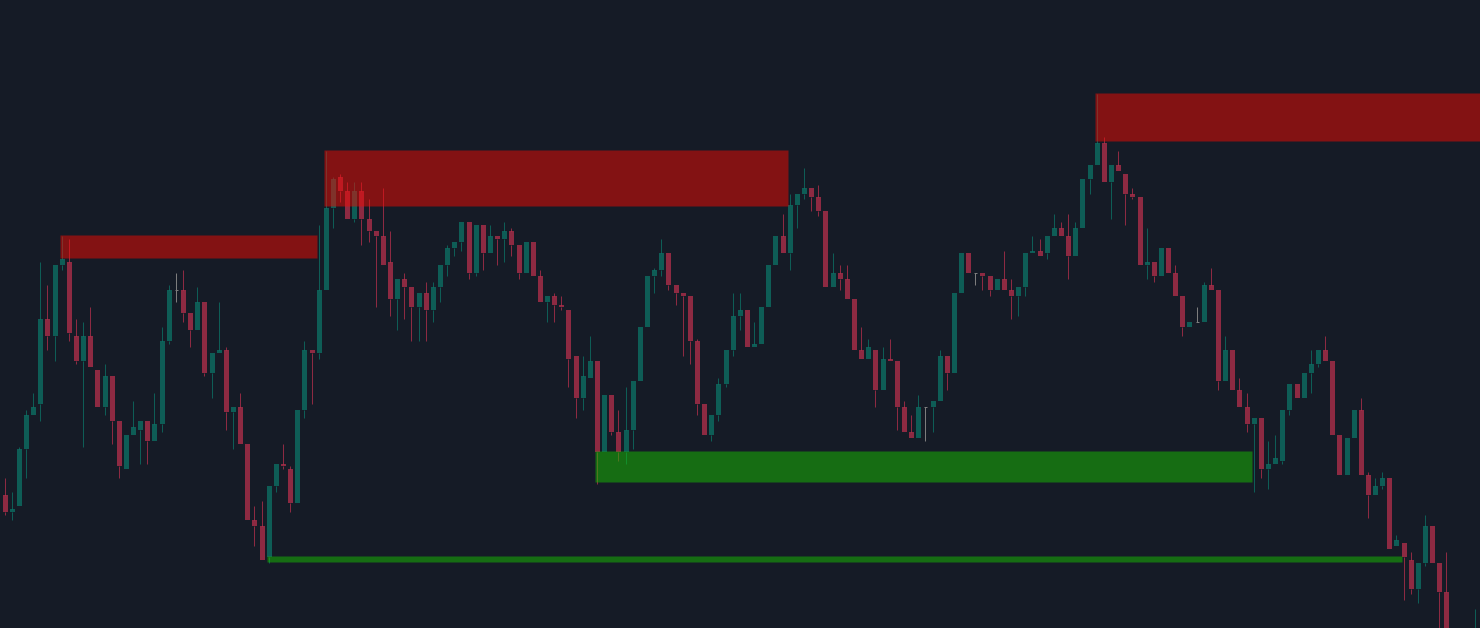
A digital stock chart showing price fluctuations with red resistance zones at the top and green support zones at the bottom.

IMBALANCE LEVELS

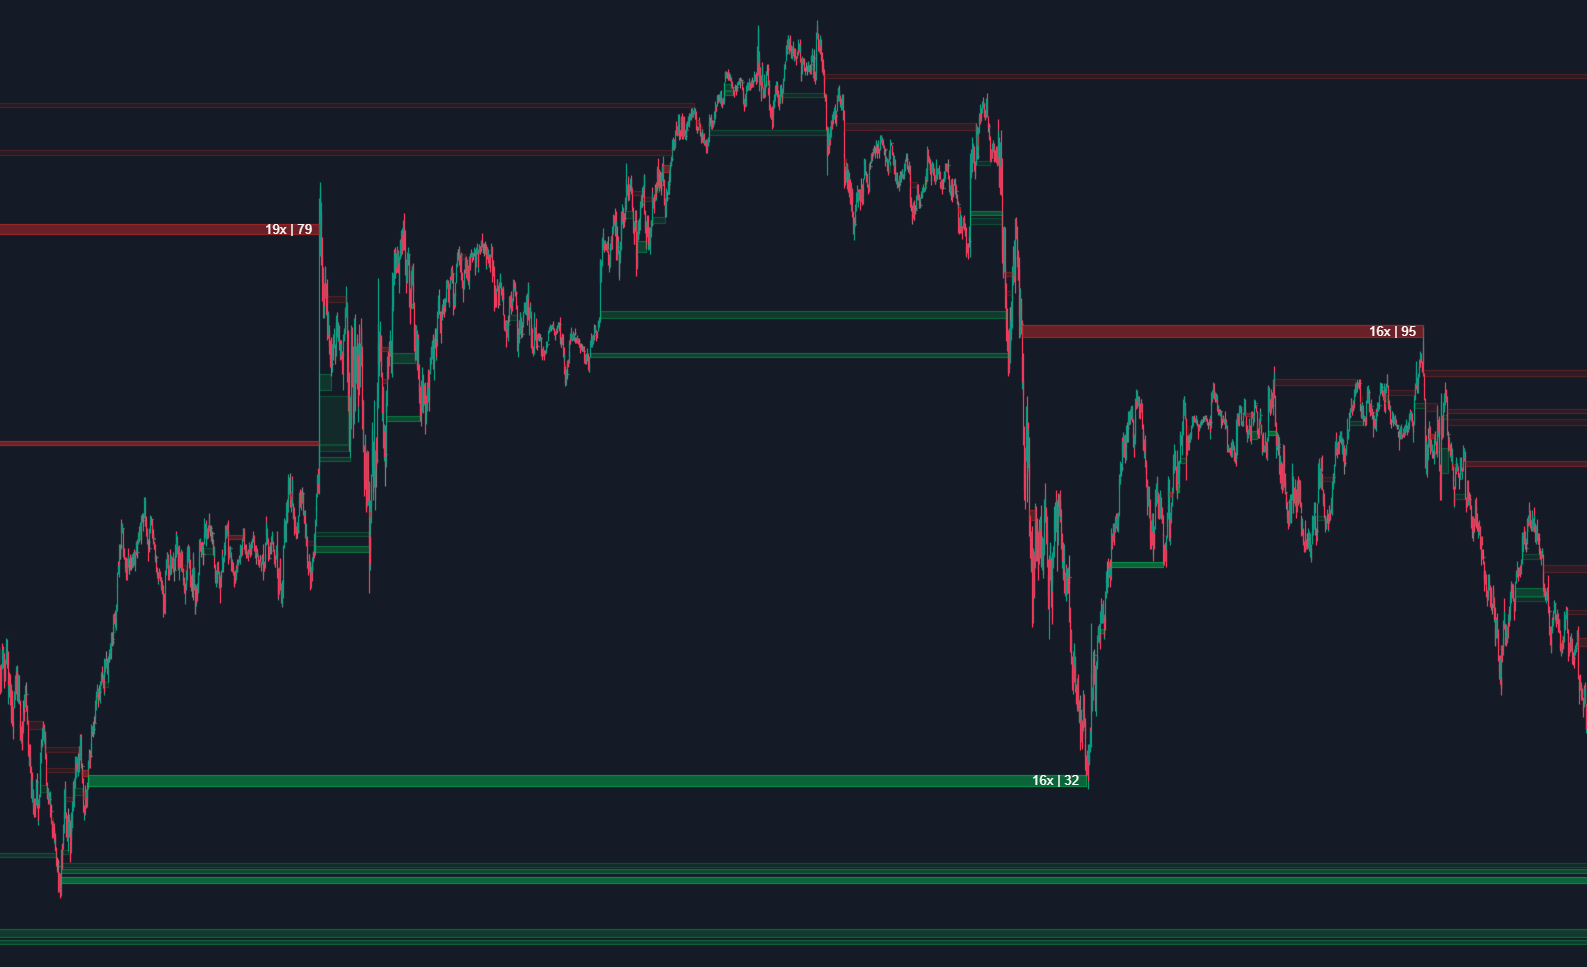
A levels indicator that identifies strong stacked imbalances, color-weighted with ratio and volume data.
How do I add free indicators?

Step 1: Ensure latest version of ATAS is downloaded

PROMO CODE: P6B17EPNB9
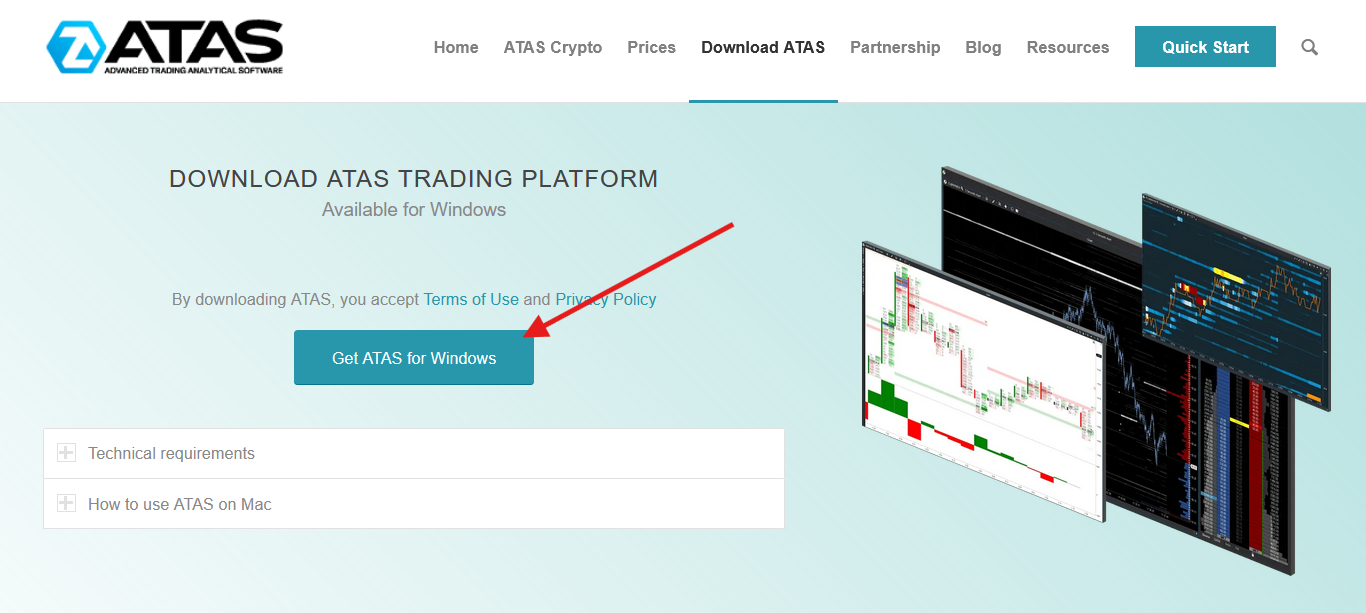
Screenshot of ATAS trading platform download webpage showing a blue button labeled "Get ATAS for Windows" and three screens of trading charts with line and bar graphs.

Step 2: Download indicators for free

A digital image displaying a financial indicator called Delta Surge, with a candlestick chart showing price movements and an arrow pointing to a 'Download' button.
A computer screen showing a file named Delta Surge.dll in a download manager interface.

Step 3: On ATAS, click “Indicators” and upload the .DLL file as shown below.
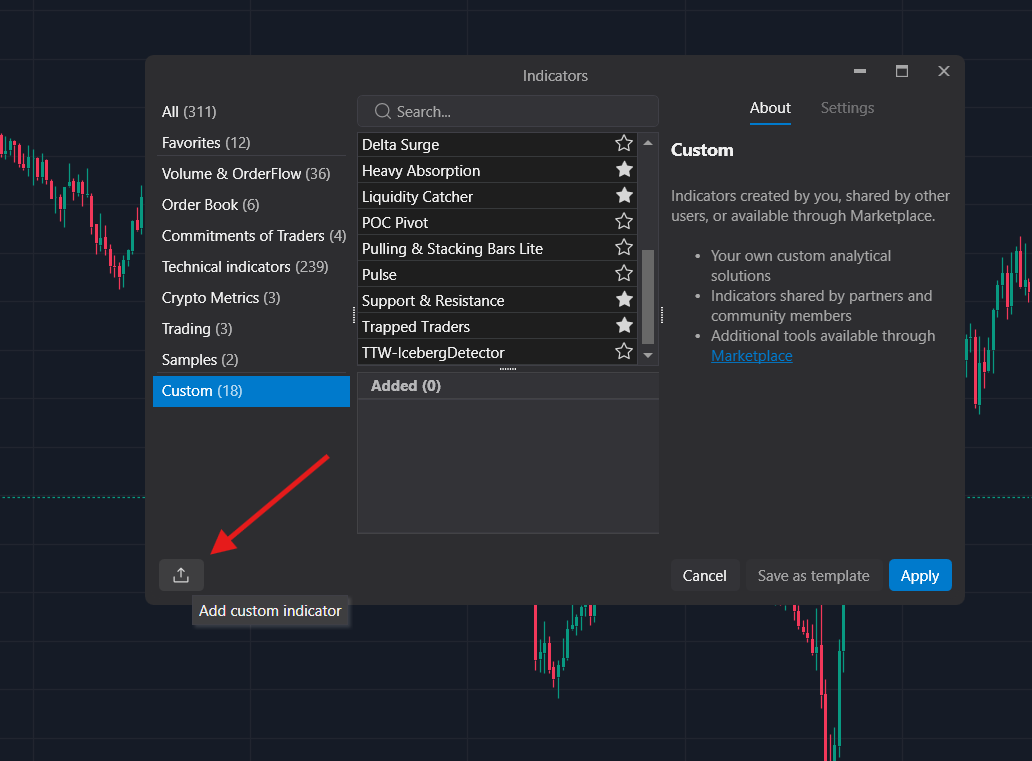
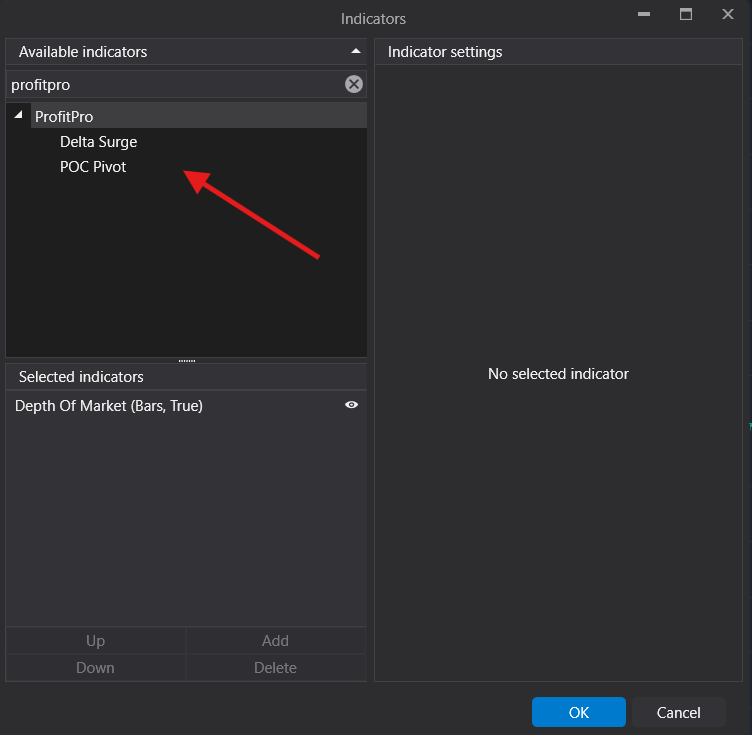
Step 4: Restart the ATAS platform and add the indicator to chart
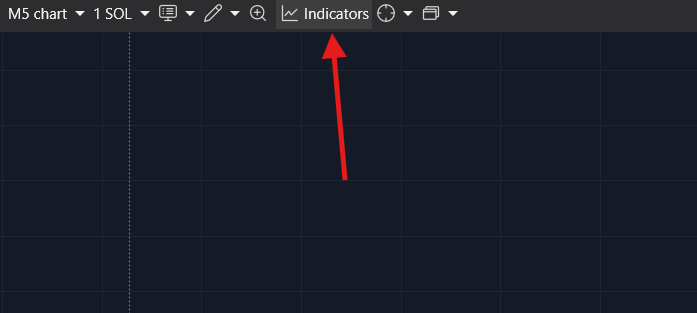
The image shows a dark theme interface of a charting or trading application with a menu bar at the top. An indicator icon is highlighted with a red arrow pointing to it.
Screenshot of a trading or financial analysis software showing available indicators like Delta Surge and POC Pivot under the 'profitpro' category, with no indicators currently selected.